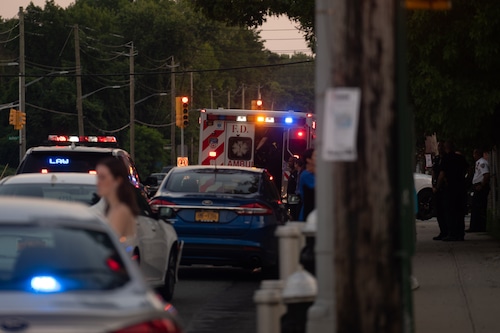
New York’s Staten Island — Although driving safely and attentively is the best strategy to prevent a fatal collision, the kind of vehicle you’re driving may also have a significant impact on your chances of surviving one.
In order to identify the cars most likely to be involved in a fatal incident, a recent study from the automotive research firm iSeeCars.com examined fatality data from the U.S. Fatality Analysis Reporting System for models of 2018–2022.
Karl Brauer, an executive analyst at iSeeCars, stated that new automobiles are safer than ever before. Today’s car models offer exceptional occupant protection because to enhanced chassis design, driver assist technologies, and several airbags encircling the driver. However, inattentive driving and increased speed are countering these safety features, which has resulted in an increase in accidents and fatalities in recent years.
Since the average fatal accident rate for all vehicles is presently 2.8, the study analyzed the fatal accident rate per billion vehicle miles to identify which models were involved in the most deadly incidents.
According to the data, 23 car models had a fatal accident risk that was at least twice as high as the average car, with the five deadliest having rates that were more than four times higher than the average.
With a fatal accident rate of 13.9 per billion vehicle miles—nearly five times the national average—the Hyundai Venue was determined to be the most deadly car.
The bulk of the cars on the list have outstanding safety ratings, according to experts, suggesting that outside causes might play a factor in the high death rates.
“It isn’t a vehicle design issue because the majority of these vehicles received excellent safety ratings and performed well in crash tests at the IIHS and NHTSA,” Brauer said. A mix of driving circumstances and driver conduct is probably reflected in the models in this list, which increases collisions and fatalities.
With a fatal accident rate of 5.6 per billion miles for all Tesla vehicles, Tesla topped the list of the most dangerous brands, somewhat higher than Kia’s second-place rate of 5.5.
These are the top 23 most deadly vehicles in the nation.
1) The Hyundai Venue
-
13.9 fatal accidents per billion vehicle miles
-
4.9x national average
2) The Chevrolet Corvette
-
13.6 fatal accidents per billion vehicle miles
-
4.8x national average
3) The Mitsubishi Mirage
-
13.6 fatal accidents per billion vehicle miles
-
4.8x national average
4) The Porsche 911
-
13.2 fatal accidents per billion vehicle miles
-
4.6x national average
5) The hybrid Honda CR-V
-
13.2 fatal accidents per billion vehicle miles
-
4.6x national average
6) Model Y Tesla
-
10.6 fatal accidents per billion vehicle miles
-
3.7x national average
7) The G4 Mitsubishi Mirage
-
10.1 fatal accidents per billion vehicle miles
-
3.6x national average
8) The Buick Encore GX
-
9.8 fatal accidents per billion vehicle miles
-
3.4x national average
9) The Kia Forte
-
8.1 fatal accidents per billion vehicle miles
-
2.9x national average
10) The Buick Envision
-
8.0 fatal accidents per billion vehicle miles
-
2.8x national average
11) The Kia Soul
-
7.3 fatal accidents per billion vehicle miles
-
2.6x national average
12) Hybrid Toyota Corolla
-
7.3 fatal accidents per billion vehicle miles
-
2.6x national average
13) The Camaro from Chevrolet
-
7.3 fatal accidents per billion vehicle miles
-
2.6x national average
14) The Nissan Versa
-
7.2 fatal accidents per billion vehicle miles
-
2.5x national average
15) The Kia K5
-
7.1 fatal accidents per billion vehicle miles
-
2.5x national average
16) The Kia Seltos
-
6.8 fatal accidents per billion vehicle miles
-
2.4x national average
17) The Ford Bronco
-
6.6 fatal accidents per billion vehicle miles
-
2.3x national average
18) The Bronco Sport from Ford
-
6.2 fatal accidents per billion vehicle miles
-
2.2x national average
19) The Dodge Charger
-
6.1 fatal accidents per billion vehicle miles
-
2.1x national average
20) The Toyota Prius
-
5.9 fatal accidents per billion vehicle miles
-
2.1x national average
21) Model S Tesla
-
5.8 fatal accidents per billion vehicle miles
-
2.0x national average
22) INFINITI Q50
-
5.8 fatal accidents per billion vehicle miles
-
2.0x national average
23) The Toyota Venza
-
5.6 fatal accidents per billion vehicle miles
-
2.0x national average
More Data Stories:
-
This graph shows rising rent prices of Staten Island apartments, by number of bedrooms
-
Rent prices spiked nearly 60% in these Staten Island neighborhoods over past decade, data shows
-
Private health insurance costs in New York to jump nearly 20% in 2025, data shows
-
Here are the 10 most expensive neighborhoods in NYC, reports shows
-
U.S. to add 6.7M jobs in next decade; these titles expected to see most job growth
Note: Every piece of content is rigorously reviewed by our team of experienced writers and editors to ensure its accuracy. Our writers use credible sources and adhere to strict fact-checking protocols to verify all claims and data before publication. If an error is identified, we promptly correct it and strive for transparency in all updates, feel free to reach out to us via email. We appreciate your trust and support!


+ There are no comments
Add yours